Sensor data is a fundamental part of smart homes and the Internet of Things (IoT). A smart home without sensors is just some convenient remote controls and simple scheduled tasks. Also, the sensor data alone can provide information for us to better understand the home environment. The first step for utilizing the sensor data is to build a simple sensor dashboard.
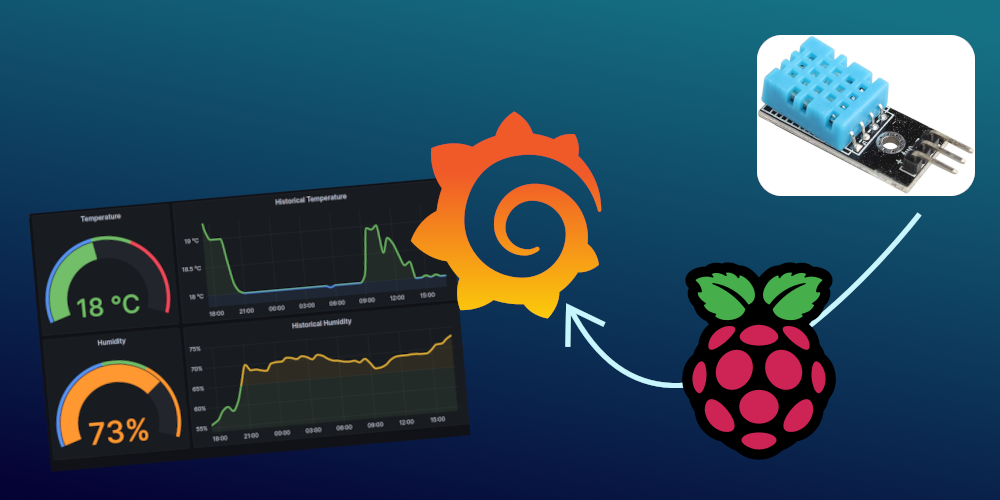
For the hardware part, I use a Raspberry Pi with DHT11, a temperature and humidity sensor. For the software part, I chose Grafana for an easy but powerful dashboard. Also, InfluxDB is used for historical data storage.
You might find someone else using a stack of MQTT server + Telegraf + InfluxDB + Grafana, but I think that's overkill. Since everything runs locally on the Raspi, there is no need for the MQTT protocol. That's because MQTT is a protocol for unstable networks and low power usage, which is not the case here.
Now, it's time for the setup!
Composing Grafana and InfluxDB #
The docker-compose file is quite straightforward. Save the file as docker_compose.yml and run docker compose up -d will start Grafana and InfluxDB.
version: "3"

services:
  grafana:
    image: grafana/grafana
    container_name: grafana
    restart: always
    volumes:
      - grafana-data:/var/lib/grafana
    ports:
      - "3000:3000"
  influxdb:
    image: arm32v7/influxdb
    container_name: influxdb
    restart: always
    volumes:
      - influxdb-data:/var/lib/influxdb
    ports:
      - "127.0.0.1:8086:8086"

volumes:
  grafana-data:
influxdb-data:One thing to notice is that we are using InfluxDB 1.x instead of 2.x, which doesn't support ARM 32-bit. InfluxDB 2.x is very different from 1.x, providing a web UI and much more cool stuff, while InfluxDB 1.x acts more like a standard database. In our example, InfluxDB 1.x is enough because we are just looking for persistent data storage. Also, we are not exposing InfluxDB to the internet because we just need to access it locally (from Grafana and the Python program we will write next).
Reading and storing the data #
DHT11 is quite a simple sensor because all you need to do is read data from it. For some sensors out there, some complex setup is required. Besides, DHT11 is cheap. Therefore, it's perfect for beginners to experiment.
You can find many tutorials on how to wire it on the Internet. Here is one diagram from Circuit Basics
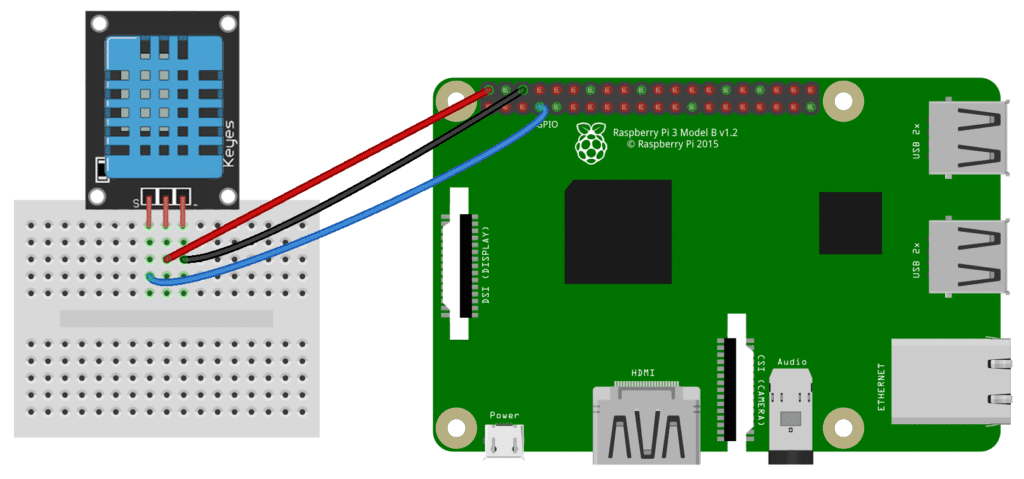
To read the sensor data, we use the Adafruit_DHT library. It's so easy to use that all you need is
humidity, temperature = Adafruit_DHT.read_retry(Adafruit_DHT.DHT11, DHT_PIN)where DHT_PIN is the GPIO pin used. Here I'm following the popular choice of PIN 7 (GPIO PIN 4).
Before writing data to InfluxDB, we first need to create a database called sensors:
docker exec -it influxdb influx
> CREATE DATABASE sensors;Of course, one can create the database via HTTP API request, but for simplicity, we just create the database manually.
Optionally, you can create a database account and set up some authorization, but we are not doing that here because we are doing a simple setup and the database can only be accessed locally.
Writing data is also as easy as POSTing the following data to http://127.0.0.1:8086/write?db=sensors
measurement,tag=name value=123 1434055562000000000The complete program looks like this:
import time

import Adafruit_DHT
import requests

DHT_SENSOR = Adafruit_DHT.DHT11
DHT_PIN = 4

DATA_TEMPLATE = """\
temperature,sensor=DHT11 value={temperature:.1f} {time}
humidity,sensor=DHT11 value={humidity:.1f} {time}"""

while True:
    humidity, temperature = Adafruit_DHT.read_retry(DHT_SENSOR, DHT_PIN)
    if humidity is not None and temperature is not None:
        requests.post("http://127.0.0.1:8086/write?db=sensors", data=DATA_TEMPLATE.format(
            temperature=temperature,
            humidity=humidity,
            time=int(time.time()*1e9),
        ))
        print("Temp={0:0.1f}C Humidity={1:0.1f}%".format(temperature, humidity))
    else:
        print("Sensor failure. Check wiring.", (humidity, temperature))
time.sleep(60)Building the dashboard #
Configuring the networking for Grafana is out of the scope of this article. You can use anything you want: VPN, Nginx, Traefik, etc. After setting up the networking and initializing a Grafana account through web UI, you need to add an InfluxDB data source by clicking the "Configuration" button in the left sidebar. There are many options, but you only need to set the HTTP URL to http://influxdb:8086 and Database to sensors. Then click save.
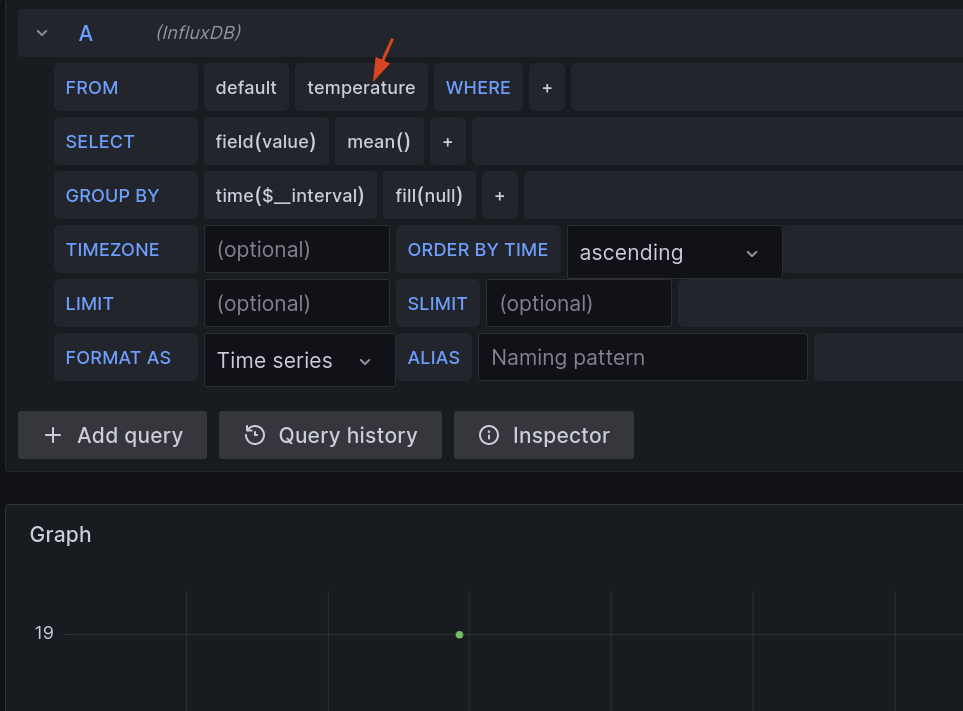
To explore the data, click the "Explore" button on the sidebar. You will see a query builder. Just click the "select measurement" button and choose "temperature". A graph will show at the bottom. Then you can click the "Add to dashboard button" on the top of the page to build a dashboard.
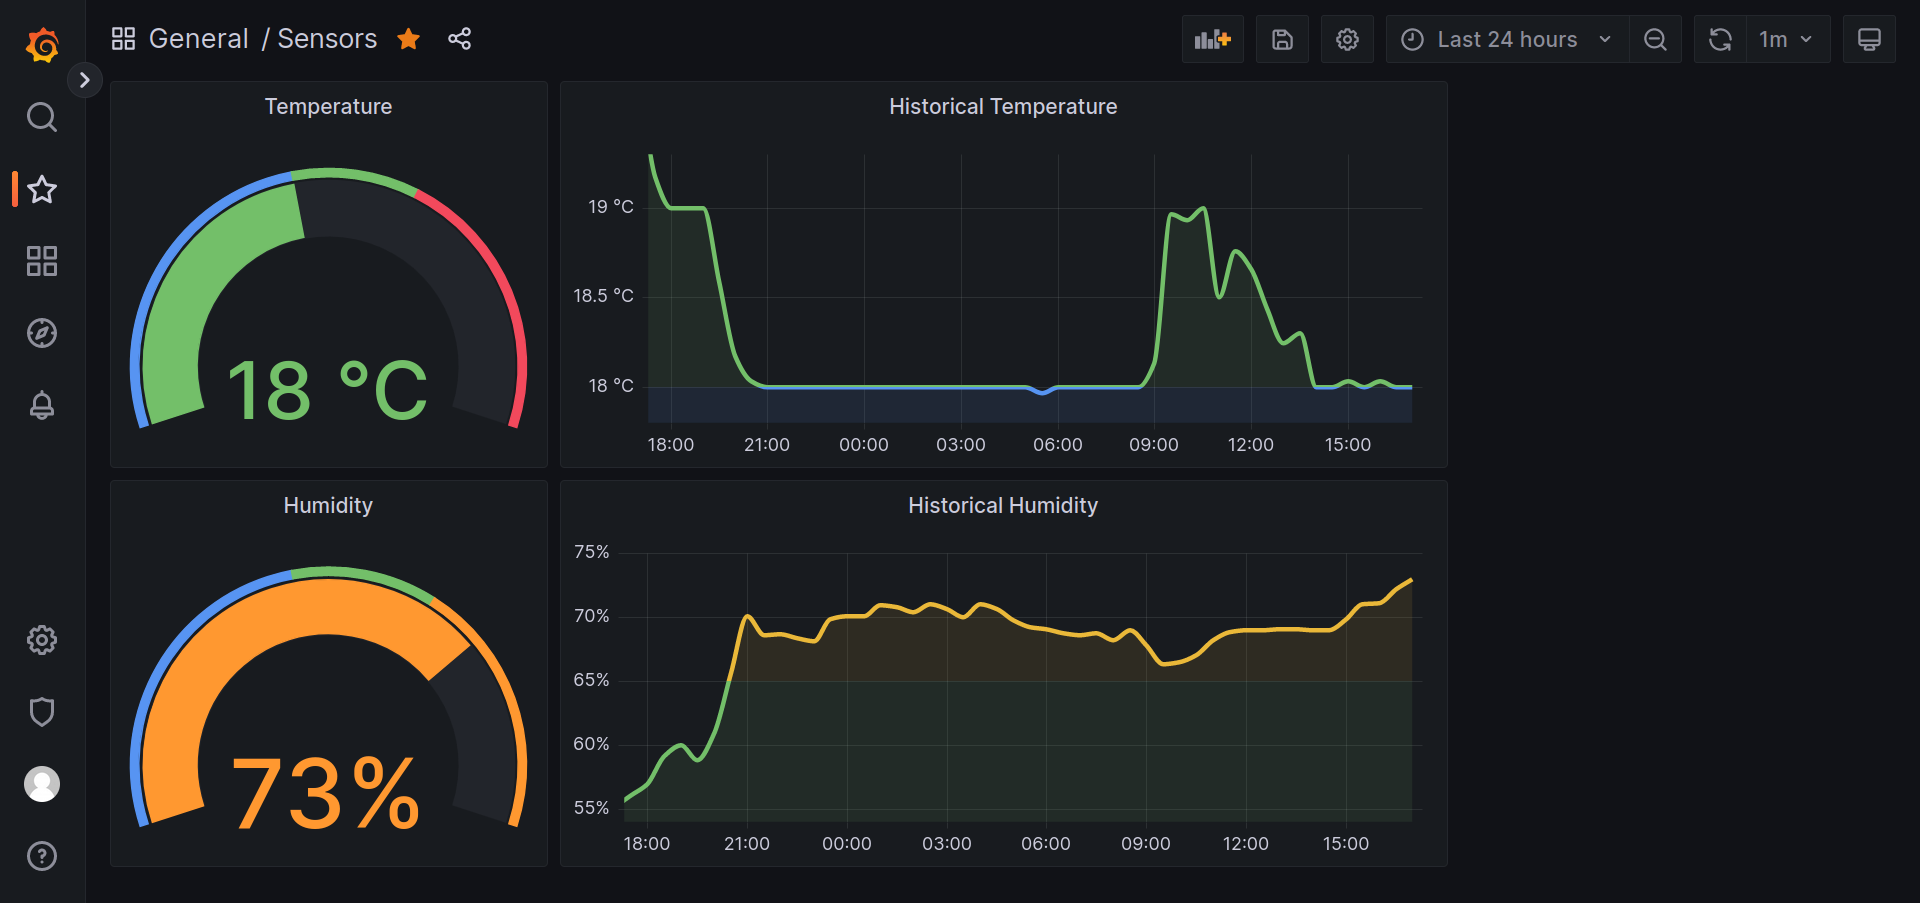
That's the very basics of building Grafana dashboards. You can find more tips and tricks when exploring and on the Internet. If you need some inspiration, here is what I've built:
Keep the program running #
So far we have built a beautiful sensor dashboard with Grafana, InfluxDB, and Python. Grafana and InfluxDB are managed by Docker. One thing left is to keep the Python program running.
The easiest way is to create a cron job using crontab -e to start the program after boot.
@reboot python3 /path/to/script.pyAlternatively, you can use the supervisor.
sudo apt install supervisorAnd create /etc/supervisor/conf.d/sensors.conf
[program:sensors]
command = python /path/to/script.py
autostart = true
user = piThen, use sudo supervisorctl reload to load the configuration and start the program.
What's next? #
The temperature and humidity data is not enough and more data need to be collected. I'll play with some more types of sensors and enrich the dashboard!